Reports are used to tally something like a number of Jobs or Activities, based on certain criteria. Before you start to create your Report, identify what are you trying to count or add. While you can display multiple Fields in a report, you can only count or add one thing.
- From the left side navigation, click on Reports, then click the +Create icon at the top of the page to create a report.

- Select the criteria for generating the report.
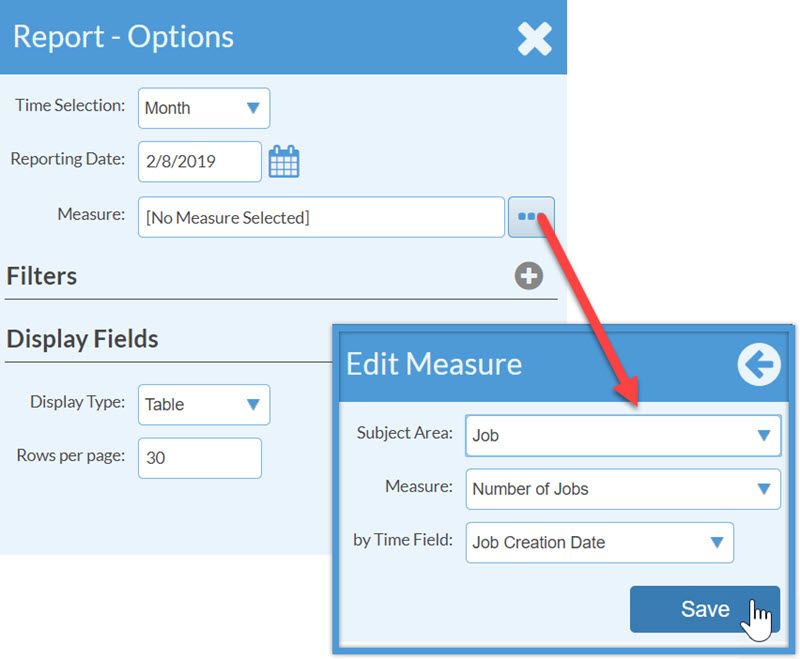
Time Selection: Select from the drop-down list of preset time selections. Select "Custom" to enter your own date parameters.
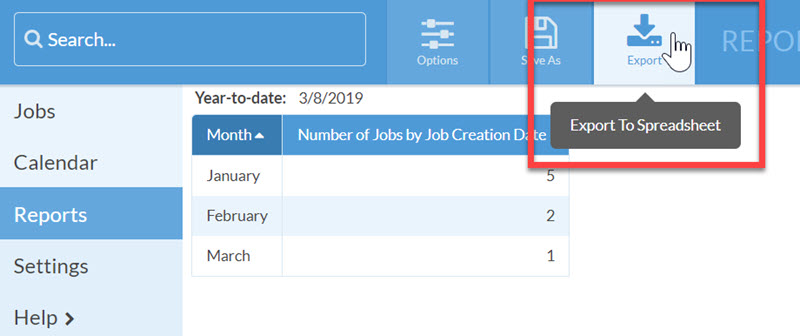
Reporting Date: Used along with Time Selection to determine what range is shown. In this example, I will see a report for the number of Jobs created in February as of 2/8/2019.
Measure: Click on the Select... button to choose the Subject Area, Measure and by Time Field.
Filters: Click the "+" button to the right of Filters and select criteria to limit the records displayed.
Display Fields: Click the "+" button to the right of Display Fields and select the fields you want to be displayed .
Display Type: Select Table or Bar Chart.
Rows per page: Select the number of rows per page you want to display.
Click Save to display the results.
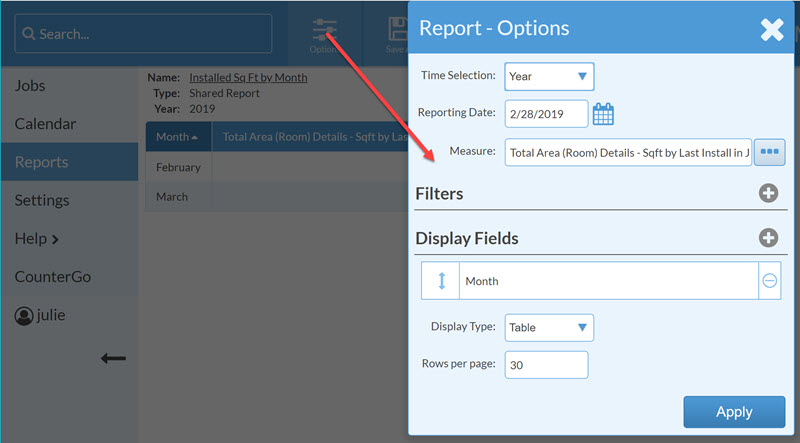
- To make changes to the report, click the Options icon at the top of the page.
- To save the report, click Save As icon at the top of the page. See Related Articles below for help with saving Reports.

- To print the Report, select to print from your browser settings.
- To export the Report into Excel for further analysis, click on the Export icon at the top of the page to download a .csv file to open in Excel or other spreadsheet software.